
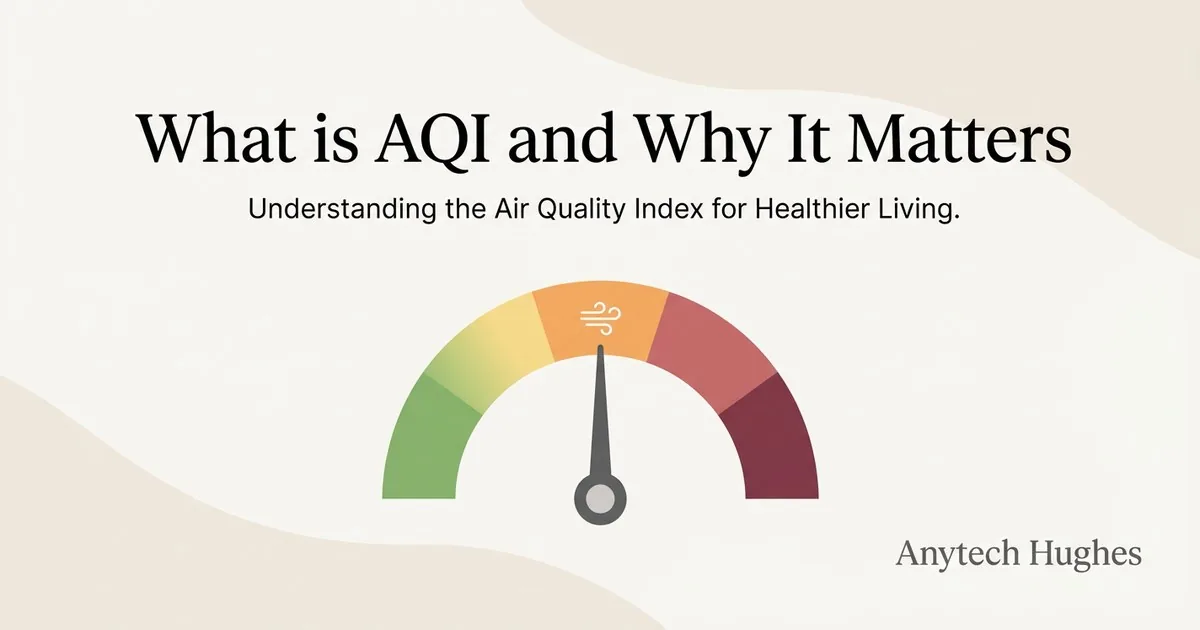
The Air Quality Index (AQI) is a standardized scale that converts complex pollutant readings into a single, easy-to-understand number. It exists because raw concentrations — micrograms per cubic metre of PM2.5, parts per billion of ozone, parts per million of carbon monoxide — mean very little to the people whose health those numbers actually affect. By translating that data into a 0–500 scale tied directly to health guidance, the AQI has become one of the most important environmental indicators in the world today, used by regulators, hospitals, schools, and increasingly by enterprises managing the spaces their employees work in.
How AQI Is Measured
AQI combines readings of major pollutants — PM2.5, PM10, ground-level ozone, nitrogen dioxide, sulphur dioxide, ammonia and carbon monoxide — into a single 0–500 scale. Each pollutant has its own concentration breakpoints, calculated from epidemiological studies linking exposure to health outcomes. Monitoring stations sample the air continuously and report concentrations on a fixed averaging window: 24 hours for particulate matter, 8 hours for ozone and CO, 1 hour for nitrogen and sulphur dioxide. The reported AQI is the worst sub-index across all measured pollutants — so a city with low PM2.5 but high ozone will still report a high AQI, and the dominant pollutant is named alongside the number. This is why a value of 180 in Delhi during winter (typically PM2.5-driven) is a different problem from 180 in summer (often ozone-driven), and the response — filtration vs ventilation timing — is different too.
What the Numbers Mean
On the standard scale, 0–50 is Good (minimal impact), 51–100 Moderate (sensitive groups may notice mild effects), 101–200 Poor to Unhealthy (everyone begins to feel some impact, sensitive groups significantly more), 201–300 Very Unhealthy (health alerts begin, outdoor activity should be limited), 301–400 Severe, and 401+ Hazardous (emergency conditions, the entire population is affected). In many North Indian cities through October to February, AQI regularly crosses 300 and frequently breaches 400 — meaning prolonged outdoor exposure is the equivalent, in PM2.5 terms, of smoking several cigarettes a day. The categories aren't arbitrary; they map to documented increases in hospital admissions for cardiac and respiratory events, which is why public-health agencies issue activity advisories tied to them.
Why It Matters for Your Organization
AQI is no longer just a public-health metric — it's an operational one. Hospitals track it because indoor air quality is now part of accreditation and infection-control scoring. Corporate offices monitor it because absenteeism, cognitive performance, and employee retention all correlate with the air people breathe at their desks. Manufacturers and infrastructure operators report it because environmental regulators expect it. Schools use it to decide whether outdoor sports go ahead. Real estate developers increasingly market indoor AQI as a leasing differentiator in cities where outdoor air is a constant concern. For any organization operating in a high-pollution geography, AQI sits alongside uptime, energy use, and safety incidents on the operational dashboard — not as a soft metric, but as a measurable input into productivity and liability.
From Awareness to Action
Knowing the AQI is the first step; the next is improving it inside the spaces you actually control. Outdoor air is a regulatory and policy problem, but indoor air — where most people spend 90% of their day — is an engineering one. The playbook is consistent: baseline the existing indoor AQI with calibrated sensors, identify the dominant pollutants for that space, deploy HEPA + activated carbon filtration sized to the room volume and occupancy, and keep monitoring continuously so the system can be tuned over time. Done well, indoor AQI can be held below 50 even on days when outdoor AQI sits above 300. Continuous AQMS monitoring and indoor air purification together close the loop between measurement and control.
How India's AQI Differs from the US AQI
The CPCB-defined Indian National AQI and the US EPA AQI use the same 0–500 visual structure but different breakpoints, which is why the same pollutant concentration can read very differently depending on which scale you're looking at. The Indian scale tracks eight pollutants (the standard six plus ammonia and lead), reflecting Indian source mix realities like agricultural emissions and industrial activity. The PM2.5 breakpoints are also looser at the upper end — what the US scale calls 'Hazardous' begins around 250 µg/m³, while the Indian 'Severe' band starts at 250 and 'Hazardous' above 430. This isn't a difference in the underlying health risk; it reflects where each country's policy thresholds sit relative to ambient reality. When comparing readings across apps and dashboards (many global apps default to the US AQI), it's worth checking which scale is in use before drawing conclusions.
Reading Beyond the Number
A single AQI value is a useful summary, but the underlying detail matters when you're making operational decisions. The dominant pollutant tells you what to filter for — particulate dominance points to HEPA-grade response, ozone or NO₂ dominance points more towards activated carbon and ventilation timing. The averaging window matters too: a 24-hour PM2.5 average of 150 hides the possibility that the past two hours sat above 300. Real-time per-hour monitoring inside your facility is what lets you respond at the right cadence — closing fresh-air dampers when outdoor spikes hit, ramping filtration during high-occupancy windows, or simply confirming that yesterday's filter swap is showing up in today's numbers.
Related Articles
PM2.5 vs PM10: What's the Difference?
The two particle sizes that dominate air quality reporting — what they are, how deep they penetrate, and which one matters more.
Read moreHow HEPA Filters Actually Work
The science behind HEPA — interception, impaction, diffusion — and why H13/H14 grades matter for indoor air quality.
Read moreChoosing the Right Air Purifier for Your Space
Sizing, ACH targets, filter stacks, and the most common mistakes — a practical guide for offices, clinics, and homes.
Read moreWant to discuss your specific requirements?
Our team can help assess and tailor a solution for your organization.
Explore Air Purification Solutions